


Profitably Scale Using Marketing Efficiency Ratio (MER)
Marketing Efficiency Ratio (MER) is a powerful metric that evaluates the effectiveness of your entire e-commerce marketing strategy beyond platform attribution.
Have you ever wondered if your marketing campaigns bring in the big bucks? That’s where the Marketing Efficiency Ratio (MER) comes in. It’s a fancy term for a simple idea: measuring your marketing efforts’ effectiveness.
Here’s how it works: you divide the revenue the business generates by the money you spent on marketing. The higher the resulting ratio, the more efficient the marketing. Simple, right?


MER calculation is simple, dividing the business revenue by the total ad spend
For example, say you spent $1000 on a campaign, and it brought in $5000 in revenue. Your MER would be 5. That means for every dollar you spent on the campaign, you got five dollars back. Not too shabby!


Why does this matter?
Tracking your MER can help ensure your marketing campaigns are working together rather than competing against one another. It can aid in determining which marketing channels are worth your time and money and which are wasting your ad spend. Plus, if you keep track of your MER over time, you can see how effective your marketing strategies are and make smarter decisions for future campaigns.
Of course, MER is just one metric out of many when evaluating marketing performance. But it’s an excellent place to start if you want to maximise your ROI, protect your bottom line, and make the most of your marketing budget.
Problems With Relying on Ad Platform Reporting (The Old Way)
When measuring the effectiveness of your marketing campaigns, one of the biggest challenges is attributing conversions to the right platform or channel.
With so many touchpoints along the customer journey, it can be hard to know which campaigns genuinely drive revenue and impact and which are just making the ad platforms more money.
The Marketing Efficiency Ratio (MER) is an invaluable tool. It offers a distinct advantage over metrics such as cost per acquisition (CPA) or return on ad spend (ROAS), as it does not depend on platform attribution.
Let’s say you’re running ads on both Meta and Google. A customer sees your Meta ad and clicks to your website but doesn’t convert. Later, they get retargeted by your Google ad, click through, and make a purchase this time. Which campaign gets credit for that conversion?

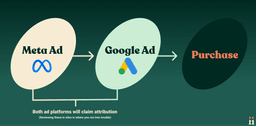
Basic customer journey, which shows that both ad platforms will claim attribution and inflate total revenue if you are only observing platform metrics
Since both channels contributed to the customer’s conversion, they will attribute the entire credit (if using the native in-platform tracking). While this is fine at the platform level as it provides more data for optimisation purposes, the overlapping attribution makes both channels appear successful individually. However, this success may differ from your overall website revenue and bank balance, which should be the ultimate objective, right?
In addition to attribution problems, ad platforms have become increasingly less reliable from a tracking point of view. Privacy changes like iOS14.5, released by Apple, which changed Meta Ads overnight, and the depreciation of the third-party cookie impacting Google make it much more difficult to accurately measure conversions on your website.
To counter this, Google has released enhanced conversion tracking, designed to bridge the gap between users who opted out of cookie tracking. On the other hand, Meta released conversion API or CAPI, a Server-Side API that allows businesses to send custom events directly to Meta (Facebook)’s servers instead of relying solely on browser pixel tracking.
However, these solutions are leading to increased modelled conversions instead of observed conversions. Modelled conversions is a statistical approach used to estimate the number of conversions that cannot be directly measured or attributed to specific advertising campaigns or channels due to privacy and tracking restrictions and cross-device journeys.
Essentially, they are estimated or assumed as opposed to actual conversions, and we’re seeing huge discrepancies between what the ad platforms are saying and what the business revenue is.
That’s why it’s more important than ever for companies to observe both in-platform ROAS and MER before reacting to positive/negative performance in ad platforms.
For example, if in-platform ROAS is looking above target, but you jump into an MER report, and it’s below target for the period you are reviewing, you shouldn’t be making scaling decisions because you know the platforms are likely inaccurately representing actual revenue figures.
Conversely, if in-platform ROAS is looking weak, but your business MER is above target, you may hold firm and not make optimisations to pull back on ad spend.
MER is another data point for you to get smarter with optimising your marketing channels!
Here is how we look at MER/ROAS for some of our brands daily:

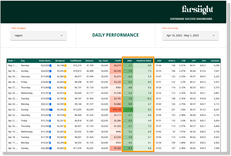
Daily MER report also pulling in platform revenue across all channels to closely monitor the relationship between MER and Platform ROAS
The Benefits of Using Marketing Efficiency Ratio for Your E-commerce Business
MER doesn’t get bogged down in platform attribution.
It simply looks at the overall revenue generated by the campaigns. It compares it to the total spend, evaluating the effectiveness of your marketing strategy as a whole rather than just individual campaigns. So if both the Meta and Google campaigns contributed to the final sale, neither gets individual credit, but instead, the credit goes to the omnichannel strategy at play.
It acknowledges the synergies and interdependencies among various marketing channels, giving credit to the omnichannel strategy. For example, if a customer was influenced by your Meta and Google campaigns before making a purchase, neither platform gets individual credit; instead, the credit is attributed to the combined efforts of the omnichannel strategy.
How do you then assess the performance of individual platforms? There are specific tactics for this. The key is ensuring all channels have visibility on one another and, most notably, that your tests and budget changes are structured and timed strategically rather than made ad hoc.
Integrating your data sources and establishing precise tracking mechanisms to capture the interactions and touchpoints across different platforms is vital. By having a comprehensive view of your customer’s journey, you can understand the overall impact of each platform within the context of your omnichannel strategy.
So, setting platform-specific Key Performance Indicators (KPIs) based on historical performance and future objectives remains crucial, especially from a media buying perspective. These KPIs serve as benchmarks for evaluating the performance of individual platforms and campaigns. However, it’s essential to approach these metrics strategically and avoid making ad hoc changes to budgets or strategies. By strategically structuring and timing your tests and budget adjustments, you can ensure that the insights derived from platform-specific KPIs align with the broader objectives of your marketing strategy and contribute to optimising your overall MER.
Setting platform-specific KPIs based on historical performance and future objectives is still recommended, as these KPIs guide media buying decisions with MER.
What is Considered a Healthy MER?
Much like ROAS, if you are saying you want a 5x or 10x MER because your friend who also owns an e-commerce business is achieving this, and it sounds good, then you’re already doing it wrong…
Determining a specific value for a “healthy” Marketing Efficiency Ratio (MER) needs careful calculating as it varies depending on each business’s unique circumstances and unit economics.
Several factors influence what might be considered a healthy MER. These factors include industry and competitive landscape, business model, target audience, product pricing, and marketing strategies.
For example, a startup in a highly competitive industry may require significant upfront investments in marketing to establish brand awareness and acquire new customers, which in this day and age, is expensive and will result in a lower MER. On the other hand, an established business with an organic following, loyal customer base and high repeat purchase rate may achieve a higher MER.
Unit economics is also crucial in determining target MER and marketing budgets. The profitability of each sale and, in some cases, the lifetime value of a customer are critical considerations. A business with high-profit margins or customer lifetime value can afford to spend more on marketing. Or a well-established company that’s achieved economies of scale has a lower COD than its competitors and can reach a more significant profit margin for the same MER.
Here is a very basic example of how this could look:

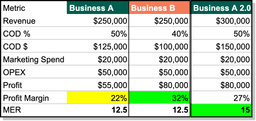
Example of a basic unit economics calculation factoring in revenue, cost of delivery, OPEX and marketing spend to display how MER
Business B has a lower cost of delivery compared to Business A and subsequently achieved a 10% higher profit margin or $25k more profit, despite reaching the same MER. In Business A 2.0, the revenue and marketing efficiency needed to be $300,000 and 15, respectively, to achieve the same profit of $80,000.
You can see how MER is unique to your business.
Conversely, businesses with slim margins or low customer lifetime value may need to be more cautious with their marketing expenses and achieve a higher MER to meet their profit targets.
It’s important to note that MER is not an evergreen, static number you set and forget. It must be regularly monitored and updated with the upcoming business objectives and financial changes.
The Relationship Between Profitability & Marketing Efficiency Ratio
Marketing Efficiency Ratio (MER) can give us great insights into profitability.
First, let’s review what we mean by “profitability.”
Profitability is the measure of how much profit you’re generating for every dollar you spend on marketing. Here’s an example of a simplified formula for this point:
- Profitability % = Revenue – cost of goods sold – Marketing costs) / revenue
- Profit $ = Revenue – (COGs + Marketing Costs)
In other words, profitability tells you how much of your revenue is left over after subtracting your cost of goods sold and your marketing costs.
Note here we’re calculating gross profitability. Other factors need to be considered, like variable costs associated with the product and fixed costs that fall into your operating expenses.

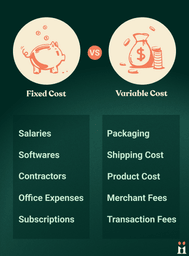
An example of typical variable costs that relate to product and fixed or operating costs
Now, let’s see how MER impacts profitability.
Say you have a marketing campaign that generates $10,000 in revenue, and you spent $2,000 on marketing to get those results. Your MER would be:
- MER = $10,000 / $2,000 = 5
Let’s say you optimise your campaign and increase your revenue to $20,000, but you also increase your marketing spend to $4,000. Your MER would be the same:
- MER = $20,000 / $4,000 = 5
However, your profitability would increase because you’re generating more revenue:

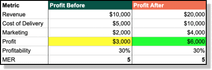
Example showing how the same MER can produce more profit based on higher marketing spend and revenue.
As you can see, even though your MER remained the same, your increased revenue allowed you to generate more profit.
However, a static MER target can be dangerous and get in the way of you scaling your revenue.
As we’ll speak to in the sections below, as you invest further in new customers, you should expect your MER to decrease (new customers are much more expensive to convert than existing ones).
Here’s an example of one of our clients who’s in scale mode. We aim to scale revenue whilst working towards a minimum profitability target of 30%.
We won’t get there in Scenario 1 despite the highest MER, but as we invest further in advertising spend, we’ll see MER decrease and profit decrease.

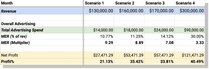
Scenario that shows the relationship between MER and Profit % as revenue increases
Remember, profit’s always the end goal!
How Can Market Factors Influence Marketing Efficiency Ratio
Several common market factors can influence MER, and it’s essential to be aware of these when making decisions about your marketing strategy.
Market Factor 1 – Competition
One major factor that can influence MER is the level of competition in your market. If you’re operating in a crowded market, generating a “high MER” can be more difficult. This is because you may need to spend more money on marketing to keep up with your competitors, and it can be harder to stand out and generate revenue from your marketing efforts.
If you see an unexplained dip in MER, check out what your competitors are doing before you react and change your ad campaigns. Are they running a promo, or have they released a new product?
Competition can be frustrating, but it keeps you on your toes, striving to stay one step ahead.
Market Factor 2 – Product Demand
Another factor that can influence MER is the level of demand for your product or service. If there is high demand for what you offer, you can generate a higher MER because your marketing efforts will align highly with consumer wants + needs. If demand is low and you need to spend a significant portion of your advertising spend on educating the market on the benefits, generating revenue from your marketing spend can be more challenging, and your MER may be lower.
Have you tried selling suitcases during a pandemic? Although possible (our team have done it!), you’re working with lower demand and must adjust your targets accordingly.

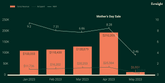
Product demand was up during April due to a Mother’s Day sale. We strategically increased budgets throughout March to fill the funnel with new users ready for the sale.
Market Factor 3 – Seasonality
Seasonality can also have an impact on MER. For example, if you’re selling holiday-related products or services, you may see a spike in demand during certain times of the year. If you adjust your marketing spend to reflect this seasonality, your MER could be better. Similarly, if you’re running a promotion or sale, you may see a temporary increase in revenue from your marketing efforts, but this may not be sustainable over the long term.
If you run a promotion and your MER is higher, your profit may not be positively impacted. This is because your gross profit per sale will be below average due to the discount in your promotion.
We recommend always considering your gross profit + operating costs when determining your offer and re-calculating your required MER based on overall metrics. We see brands dropping huge sales on Black Friday to try and compete, but not considering what they can afford to discount and stay profitable. It’s a dangerous position to be in!
Market Factor 4 – Economic Environment
Changes in the broader economic environment can also influence MER. For example, if there is a recession or economic downturn, consumers may be less likely to spend money on non-essential items, which could lower your store conversion rate and, subsequently, the MER. However, a strong economy will have consumers feeling financially secure, and you may be able to generate a higher MER.

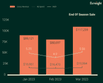
As we can see above, January marked a great start to the year for this business. With a solid revenue of $89.1K and an investment of $16.9K in marketing, we achieved an MER of 5.25. This means that for every dollar we spent on marketing, we generated $5.25 in revenue. The marketing strategy was on point, aligned our MER targets and positively impacted our profitability right from the get-go.
However, February brought a slight dip in revenue. We observed a decrease to $80.6K with a spend of $16.4K, resulting in an MER of 4.9. Now, no need to panic just yet! It’s important to note that we didn’t have any sales events or promotions in February. Various market factors, including the economic environment, could influence the lower revenue and MER. External conditions sometimes affect consumer spending habits, leading to a decline in the store conversion rate and, consequently, a lower MER. It’s a good reminder that market influences are always at play.
Australia is also experiencing consecutive interest rate hikes, and combined with other economic pressure, has likely had an impact on consumer spending so far this yea.
But wait for it; March brought some exciting news. Despite a higher marketing spend of $19.9K, our revenue skyrocketed to an impressive $117K, boasting a strong MER of 5.9. What made the difference? We strategically launched an end-of-season sale in March. This move proved a game-changer, driving revenue through the roof and shining the spotlight on our MER. Customers couldn’t resist the allure of discounted prices, creating a sense of urgency that resulted in higher store conversion rates and remarkable revenue generation.
These figures demonstrate how market factors, particularly the economic environment, can significantly impact the MER. During a recession or economic downturn, consumers tend to be more cautious with their spending, directly affecting the store conversion rate and, subsequently, the MER.
So, what’s the key to success? Strategic planning! By carefully planning our promotions and sales events, we can effectively navigate market factors and turn them into opportunities for profitability. Our March end-of-season sale exemplified this, boosting revenue and leaving our MER shining brightly. It’s a testament to the power of a well-executed marketing strategy that can truly transform your business’s bottom line.
Accounting for Market Factors
So how can you account for these market factors when calculating MER and making decisions about your marketing strategy? One approach is to use data and analytics to monitor your performance over time and identify trends and patterns. By tracking your MER and other critical metrics over time, you can see how market factors affect your performance and adjust your strategy accordingly.
For example, if your MER is consistently lower during certain times of the year, you may want to adjust your marketing spend to account for this seasonality. Similarly, if you see a drop in demand for your product or service, reduce your marketing spend while revisiting your marketing strategy.
Ultimately, the key to success in marketing is to be agile and adaptable and to use data and analytics to make informed decisions about your strategy. By understanding how market factors influence your MER, you can take proactive steps to optimise your marketing spend, maximise your profitability, and avoid making costly reactive ad-platform decisions.
Strategies For New Customer Acquisition Using Marketing Efficiency Ratio
Now this sounds relatively easy if the markets were stable and nothing would influence them. However, let’s explore how a New Customer Acquisition strategy can affect the Marketing Efficiency Ratio (MER) and impact profitability.
First, let’s review what a New Customer Acquisition strategy means. This strategy focuses on acquiring new customers rather than retaining existing ones. The goal is to increase the number of customers to expand your customer base.
Let’s see how a New Customer Acquisition strategy can impact MER. When you focus on acquiring new customers, you’re likely to spend more on marketing because you’re trying to reach a larger audience that has yet to be exposed to your brand. This means your MER may initially be lower, considering it’s typically cheaper to re-engage a previous customer than to acquire a new one.
Let’s look at an example. Say you have a marketing campaign that targets your existing customers. You spend $1,000 on marketing and generate $5,000 in revenue. Your MER would be:
- MER = $5,000 / $1,000 = 5
Let’s say you switch to a New Customer Acquisition strategy and spend $5,000 on marketing to acquire new customers. You generate $20,000 in revenue from these new customers. Your MER would be:
- MER = $20,000 / $5,000 = 4
In this case, your MER decreased because you spent more money on marketing. However, your long-term revenue will ultimately increase because you have acquired new customers who will likely return and repeat purchases.
Next, let’s see how a New Customer Acquisition strategy can impact profitability. As mentioned earlier, profitability measures how much profit you generate for every dollar you spend on marketing. Let’s use the same example as before:

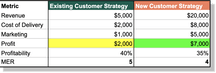
Example of an existing vs. new customer strategy and how MER is lower but produced more revenue.
In this case, the New Customer Acquisition strategy generated more revenue, but the profitability % decreased because the cost of goods sold and marketing expenses were higher. A lower profitability % isn’t necessarily a bad thing. It means you must invest further in advertising spend to reap the benefits.
A New Customer Acquisition strategy can impact MER and profitability in different ways. While you may spend more on marketing initially, the strategy can lead to increased revenue and a more extensive customer base. However, the cost of goods sold and marketing expenses may also increase, impacting profitability.
In conclusion, monitoring MER and profitability is vital to achieving your goals when implementing a New Customer Acquisition strategy. While a lower MER may be acceptable if revenue is increasing, it’s essential to consider the short and long-term impact on profitability. You can make informed decisions and adjust your strategy to achieve your desired results by tracking these metrics.
Want Help Calculating Your Target MER?
We hope this article has shed light on the benefits of incorporating this new metric into your marketing strategy. With the recent privacy changes that will continue to impact platform tracking, attribution issues and more, tracking MER and your platform metrics like ROAS can help protect your brand and its sustained success in the market and find new ways to grow.
If you’d like help calculating your target MER, please get in touch with us, as this is some of our favourite work!
Like what you read?
Learn more about digital, creative and platform strategies below.