


Performance Max Best Practices & Tips From Industry Experts
Unlock the full potential of your Performance Max campaigns with actionable insights and proven optimisation strategies that drive better results.
In this blog, we uncover how to boost performance to the max in your performance max campaigns. Learn where to find all the valuable insights and best practice optimisations once you’ve analysed the data.
Unlocking the Power of Performance Max
Performance Max can feel like a black box for gaining insights across assets, demographics, and audiences. But recent updates are easing those constraints, offering more ways to optimise your campaigns than you might think.
While we may never regain the rich data we once had, there are now more levers to pull for improved performance in Google Ads Performance Max campaigns. Since our first test of Performance Max during its beta phase in 2020, we’ve refined key strategies to make this campaign type a primary revenue driver for our online retail clients.
This guide will explore how to gather insights within Performance Max, refine your approach, and continuously scale your campaigns for better results.
What is Performance Max?
Performance Max is a Google Ads campaign type that leverages machine learning to serve ads across Google’s entire inventory, including Search, Shopping, Display, YouTube, and Discovery. It optimises bidding, targeting, and ad placements in real time, using signals like user intent and behaviour to show relevant ads to potential customers.
Unlike traditional campaigns, you don’t manually select keywords, audiences, or demographics. Instead, you set an objective, define a conversion goal, upload assets, and let Google handle the rest. But don’t worry, you still have some control, and that’s what we’ll unpack now.
Where to Find Performance Max Insights
Asset Group Reporting
Asset group reporting is one of the most valuable additions to Performance Max, providing insights into impressions, clicks, conversions, and conversion rates for each asset group within your campaign. This feature, which began rolling out in early 2023, allows you to track performance across different creative, messaging, product groups, categories, and audience signals.
To access asset group reporting:
- Switch to the Table view in your asset group report.
- Modify columns to include performance and conversion metrics.
- Apply these metrics to view detailed performance data for each asset group.
With these insights, you can effectively split-test different elements to see what works best.

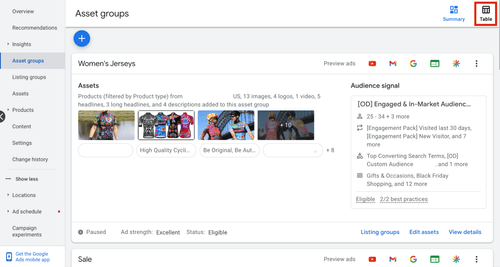
An asset group in Performance Max campaign
Next, go to columns in the top right again, and select Modify Columns.

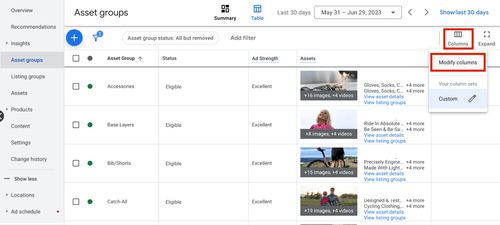
Modify columns within an asset group
If your account is lucky enough to have been whitelisted for this, then you will be able to see the “Performance” and “Conversions” options in this list. In here you will be able to select the standard metrics we know and love including conversions rate, cost/conv (CPA) and conv. value/cost (ROAS)

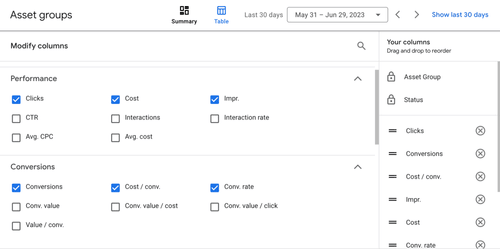
Add key performance metrics to your asset group reporting
Hit apply once you have all the metrics you’re interested in. This will produce a game-changing breakdown of these metrics against each of your asset groups.

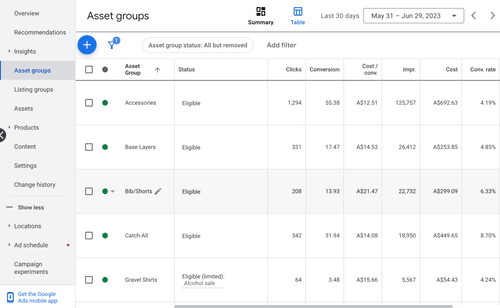
Review insights on the biggest impact metrics in your asset groups
Asset Reporting
The latest addition to Performance Max, asset reporting, provides detailed performance metrics for individual assets within an asset group. This data informs strategic decisions on asset iteration, rotation, or removal based on performance.
To view this report:
- Click on ‘Asset Groups’ in your Performance Max campaign.
- Find the enabled asset group and click ‘view details.’

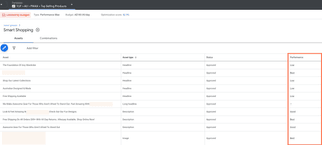
Asset reporting in Performance Max campaigns
While the metrics may not be as granular as clicks or conversions, Google provides a performance rank, helping you identify which assets are underperforming, performing well, or excelling.
Best Practices for Asset Reporting:
- Ensure your campaign has spent at least 5x your CPA target before making asset changes.
- Focus on high-performing assets and iterate based on successful elements.
- Remove low-performing assets and replace them with variations of successful ones.
Product Performance (for E-commerce Brands)
The product performance report for e-commerce brands shows how Google allocates your budget across the Google Shopping channel versus other channels. This report helps you identify top and low-performing products, guiding your next optimisation steps.

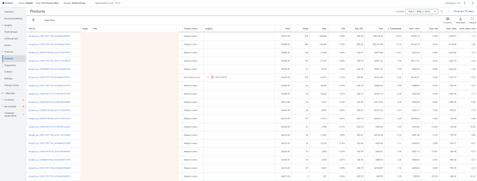
Product report to review individual product performance data
Best Practices for Product Performance:
- Focus on top-performing products with high revenue and success in Google Shopping.
- Be mindful that high ROAS doesn’t always equate to high profit, especially if the cost of goods varies.
- Before excluding underperforming products, analyse competitors and landing pages to try improving performance first.
Combinations Report
The combinations report in Performance Max shows top-performing asset combinations across all channels. While less detailed than asset performance reports, it visually represents the best combinations of text, image, and video assets.

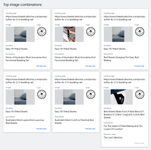
Top image combinations report in Performance Max
Search Terms Insight Report
Similar to search campaigns, the Search Terms Insight Report lists the search terms that triggered your ads, along with impressions, clicks, and conversions. While not as detailed as traditional search reports, it’s still valuable for identifying new keywords, negative keywords, and gaps in your search strategy.

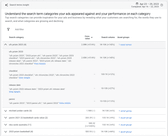
Search terms insights report in Performance Max
Best Practices for Search Terms Insight:
- Identify and add new keywords or exclude irrelevant ones.
- Improve ad relevancy by incorporating high-performing search terms into your asset groups.
- Add negative keywords through Google Support until manual addition becomes available in Performance Max.
Location Report
The Location Report provides performance data across different geographic locations, allowing you to identify top-performing areas and reduce wasted ad spend in underperforming regions.

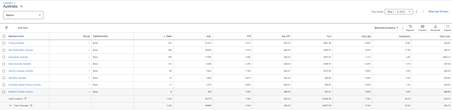
Location report to review countries, regions or more granular location data
Best Practices for Location Reports:
- Focus ad spend on top-performing locations.
- Segment underperforming locations into their own campaigns for more control and better optimisation.
Audience Insights
Audience Insights help you understand which audience segments are converting, clicking, or viewing your ads. This feature can uncover new segments and provide ideas for refining your overall business strategy.

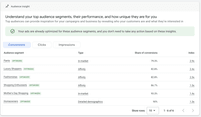
Audience insights help you review your top audience segments
Best Practices for Audience Insights:
- Target high-converting audiences with tailored AdGroups in display, discovery, or YouTube campaigns.
- Use detailed demographic insights to create specific creative angles that resonate with your target audience.
Other Performance Max Optimisation Opportunities
Audience Signals
Audience Signals in Performance Max help optimise campaigns by leveraging machine learning to target the right audience based on user behaviour across Google’s properties.


Audience signals in Performance Max
Best Practices for Audience Signals:
- Upload a customer list for Google to learn from high-value customers.
- Use Custom Intent audiences based on keywords or competitor websites to guide Google’s machine learning.
Brand Exclusions
Brand Exclusions, a new feature rolling out since July 2023, allows you to avoid serving ads for specific branded queries. This feature offers better control over where your ads appear, ensuring they don’t show for unwanted brand searches.

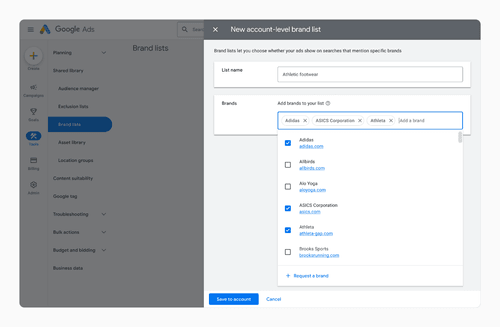
Brand exclusions in Performance Max
Landing Page Report & URL Exclusions
The Landing Page Report offers insights into how your landing pages are performing within your campaigns. It also helps you identify pages that shouldn’t be serving ads, allowing you to exclude them and optimise your budget allocation.
To find this report, go to all campaigns on the left-hand side of the page > landing pages > and filter for campaign type “Performance Max”.

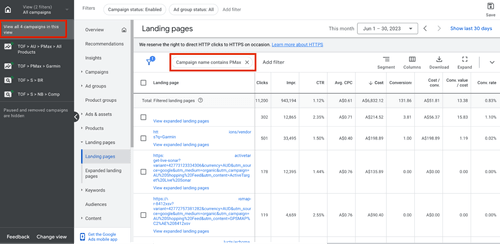
Landing Page report to see which pages your ads are serving
Once you’ve developed a list of pages you no longer want to serve ads on, go to settings > automatically created asset > exclude some URLs and enter the exact URLs you’d like to remove.

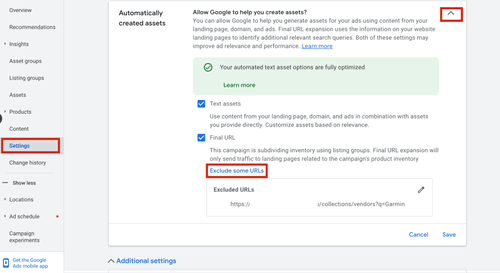
Add exclusions on your Performance Max campaigns
Placement Report & Content Exclusions
The Placement Report shows where your ads are appearing outside of Google Search and Shopping, helping you exclude low-quality placements, such as certain apps, to optimise your ad spend.

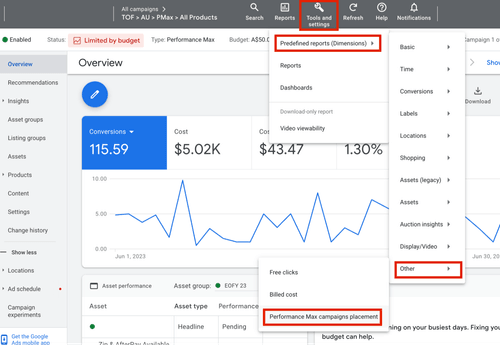
Performance Max campaigns placement report
Google Owned & Operated refers to all sites owned by Google, such as Gmail, Play, Discover and YouTube and unfortunately, you aren’t able to get anything more granular than that. Of interest in this report is everything else.
Like with Display campaigns, you can take these placements including apps and URLs, and exclude them from your campaign.
Our best practice is to include Apps as standard as these placements are more often than not low quality and any budget spent here is better spent on better placements elsewhere.
It’s worth considering what other high-volume placements are serving here – if your impressions are quite high in this report, there’s a good chance you are spending a chunk of your budget on non-search placements which if return on ad spend is your goal, may be less than ideal.
Once you’re ready you can then head into the “Content” report, hit the Pencil Icon and add in your exclusions.

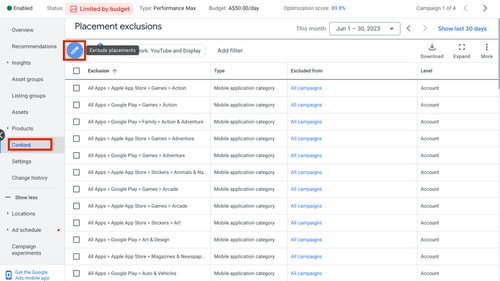
Placement exclusions in Performance Max
Final Thoughts
Performance Max has evolved significantly since its launch, providing advertisers with more tools and insights to optimise and scale their campaigns. By leveraging the insights and best practices shared here, you can take full advantage of Google Ads Performance Max campaigns to drive better results.
We’d love to hear your thoughts or additional strategies for optimising Performance Max campaigns!


Josh Somerville
Josh is the co-founder of farsiight and has spent the past 12 years scaling PPC campaigns.
Like what you read?
Learn more about digital, creative and platform strategies below.